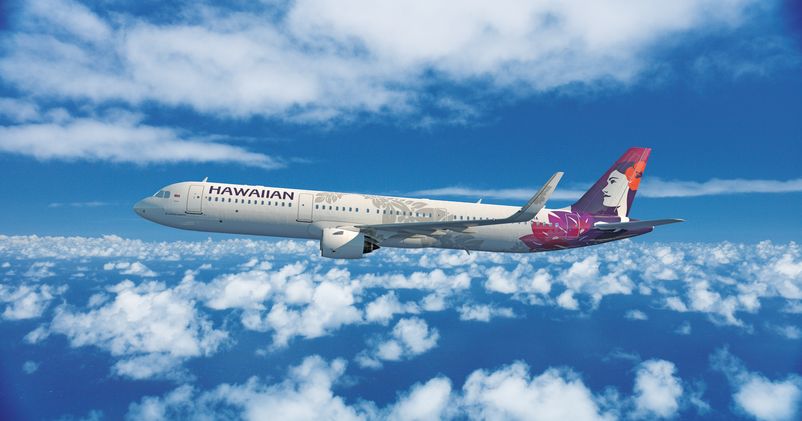
- Hawaiian Airlines has reported its earnings for the third quarter of 2019.
- It brought home a net income of USD 80.1 million, over 14% less than the comparable period last year. Diluted earnings per share went down to USD 1.70.
- “In the face of heightened competition, we delivered strong financial results and made significant progress towards accomplishing the strategic priorities that we established at the beginning of the year. As we enter the home stretch of 2019, we look forward to continuing to execute our proven formula for generating value for our guests and our investors. I extend my thanks, as always, to my 7,300 colleagues for their tireless efforts to deliver award-winning, authentic Hawaiian hospitality every day,” Peter Ingram, Hawaiian Airlines President and Chief Executive Officer, said.
- Hawaiian Airlines started operating a flight from Honolulu to Boston earlier this year. it became ‘the longest regularly scheduled interstate route in U.S. history’ with flight HA90 flying between Honolulu’s Daniel K. Inouye International Airport and Boston Logan International Airport.
PRESS RELEASE
Hawaiian Holdings, Inc. (NASDAQ: HA) (the “Company”), parent company of Hawaiian Airlines, Inc. (“Hawaiian”), today reported its financial results for the third quarter of 2019.
| Third Quarter 2019 – Key Financial Metrics | ||||||||
| GAAP | YoY Change | Adjusted | YoY Change | |||||
| Net Income | $80.1M | ($13.5M) | $81.5M | ($15.2M) | ||||
| Diluted EPS | $1.70 | ($0.14) | $1.72 | ($0.19) | ||||
| Pre-tax Margin | 14.4% | (1.0) pts. | 14.6% | (1.3) pts. |
“Our team did a fantastic job this quarter, demonstrating once again that Hawaiian Airlines is the carrier of choice for guests traveling to, from and within the Hawaiian Islands,” said Peter Ingram, Hawaiian Airlines president and CEO. “In the face of heightened competition, we delivered strong financial results and made significant progress towards accomplishing the strategic priorities that we established at the beginning of the year. As we enter the home stretch of 2019, we look forward to continuing to execute our proven formula for generating value for our guests and our investors. I extend my thanks, as always, to my 7,300 colleagues for their tireless efforts to deliver award-winning, authentic Hawaiian hospitality every day.”
Statistical information, as well as a reconciliation of the non-GAAP financial measures, can be found in the accompanying tables.
Shareholder Returns, Liquidity and Capital Resources
The Company returned $25.7 million to shareholders in the third quarter through share repurchases of $20.0 million and a dividend payment of $5.7 million.
On October 18, 2019, the Company’s Board of Directors declared a quarterly cash dividend of 12 cents per share to be paid on November 29, 2019 to all shareholders of record as of November 15, 2019.
As of September 30, 2019, the Company had:
- Unrestricted cash, cash equivalents and short-term investments of $745 million
- Outstanding debt and finance lease obligations of $782 million
Third Quarter 2019 Highlights
Leadership and People
- Appointed Robin Kobayashi as interim Senior Vice President of Human Resources.
Operational
- Ranked #1 nationally for on-time performance year-to-date through August 2019, as reported in the U.S. Department of Transportation Air Travel Consumer Report, adding to its record of 15 consecutive years as the most punctual airline.
- Implemented Amadeus’ Departure Control Flight Management to optimize load planning and improve operational efficiency.
Products and Services
- In September and October, launched sales of Main Cabin Basic fares in all North American markets, enhancing Hawaiian’s product portfolio with a fare option that appeals to the most price-conscious travelers.
Routes and Network
- Received final U.S. Department of Transportation approval to operate one additional daily nonstop flight between Tokyo Haneda Airport (HND) and Honolulu Daniel K. Inouye International Airport (HNL) starting in March of 2020.
- Announced service for three new routes with its A321neo fleet:
- Four-times-weekly service between Maui’s Kahului Airport (OGG) and Las Vegas’ McCarran International Airport (LAS) beginning December 15, 2019
- Thrice-weekly nonstop service between Honolulu (HNL) and Seattle-Tacoma International Airport (SEA) starting January 7, 2020, supplementing existing daily A330-200 service
- Seasonal winter service between Maui (OGG) and Los Angeles International Airport (LAX) from December 14, 2019 through January 5, 2020, supplementing existing daily A330-200 service
Fleet & Financing
- Took delivery of two Airbus A321neo aircraft, increasing the size of its A321neo fleet to fifteen aircraft.
- Entered into two Japanese Yen-denominated debt financings, collateralized by four Airbus A330 aircraft and two Airbus A321neo aircraft.
- Extended the leases on three A330 aircraft, enabling cost savings while maintaining fleet flexibility for future growth.
Fourth Quarter and Full Year 2019 Outlook
The table below summarizes the Company’s expectations for the fourth quarter ending December 31, 2019, and the full year ending December 31, 2019, expressed as an expected percentage change compared to the results for the quarter and the full year ended December 31, 2018, as applicable.
| Fourth Quarter | GAAP Fourth Quarter | |||||
| Item | 2019 Guidance | GAAP Equivalent | 2019 Guidance | |||
| ASMs | Up 3.0 – 4.5% | |||||
| Operating revenue per ASM | Down 0.5 – 3.5% | |||||
| Cost per ASM excluding fuel and non-recurring items (a) | Up 0.5 – 3.5% | Cost per ASM (a) | Down 0.1 – 2.5% | |||
| Gallons of jet fuel consumed | Up 0.5 – 2.5% | |||||
| Economic fuel cost per gallon (b)(c) | $2.02 | Fuel cost per gallon (b) | $1.98 |
| Full Year | GAAP Full Year | |||||
| Item | 2019 Guidance | GAAP Equivalent | 2019 Guidance | |||
| ASMs | Up 1.9 – 2.4% | |||||
| Cost per ASM excluding fuel and non-recurring items (a) | Up 1.8 – 2.6% | Cost per ASM (a) | Down 2.3 – 2.9% | |||
| Gallons of jet fuel consumed | Down 1.0 – 1.5% | |||||
| Economic fuel cost per gallon (b)(c) | $2.05 | Fuel cost per gallon (b) | $2.00 |
(a) See Table 4 for a reconciliation of GAAP operating expenses to operating expenses excluding aircraft fuel and non-recurring items.
(b) Fuel cost per gallon estimates are based on the October 10, 2019 fuel forward curve.
(c) See Table 3 for a reconciliation of GAAP fuel costs to economic fuel costs.


