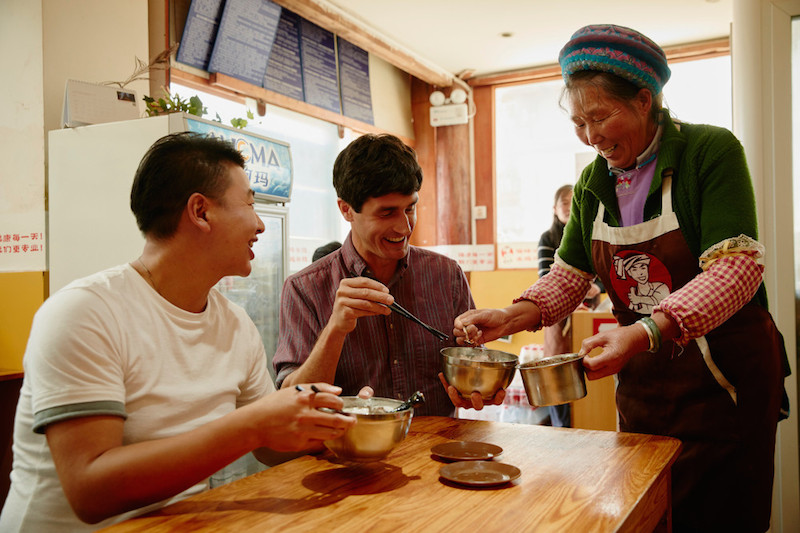
- Airbnb’s guest community spent at least an estimated USD 25 billion at restaurants and cafes in 2018 based on data for 46 countries and regions alone. If spending levels remain the same, Airbnb guests are estimated to spend over USD 30 billion at restaurants and cafes in these same locations in 2019.
- In Europe, Airbnb guests spent at least an estimated USD 11 billion at restaurants and cafes in 2018, including over USD 2.7 billion in France, USD 1.7 billion in Spain, and USD 1.3 billion in Great Britain.
- In the Americas, Airbnb guests spent at least an estimated USD 10.2 billion at restaurants and cafes in 2018, including about USD 7.6 billion in the United States, USD 989 million in Canada, and USD 650 million in Mexico.
- In Asia, Airbnb guests spent at least an estimated USD 2.4 billion at restaurants and cafes in 2018, including more than USD 755 million in Japan and USD 493 million in China.
- Airbnb guests spent an estimated USD 1.1 billion at restaurants and cafes in Australia and New Zealand in 2018, and about USD 156 million in South Africa.
- Airbnb can now be accessed in 62 languages.
PRESS RELEASE
Airbnb’s mission is to create a world where anyone can belong anywhere. For many travelers, belonging means experiencing a place through local foods and flavors by learning to cook a traditional recipe or discovering neighborhood restaurants and cafes, all while creating authentic memories and connections to a destination.
With over 7 million unique accommodations in 191 countries and regions, Airbnb promotes economic opportunity for hosts and the neighborhoods that welcome them, particularly local food establishments. According to new survey findings and an analysis of internal data released today, Airbnb’s guest community spent at least an estimated US$25 billion at restaurants and cafes in 2018 based on data for 46 countries and regions alone. If spending levels remain the same, Airbnb guests are estimated to spend over US$30 billion at restaurants and cafes in these same locations in 2019.
Unique aspects of the Airbnb community are helping to drive this spending to new places, forge offline connections and keep the benefits local. 84 percent of hosts say they recommend restaurants and cafes to guests, driving more people to visit places they might not otherwise discover online. Half of guests say they spent the money they saved by staying on Airbnb in the places they visited, multiplying the economic benefits of the Airbnb community beyond the platform. And on average Airbnb guests say 42 percent of their spending occurs in the neighborhoods where they stay, keeping the impacts local and expanding the economic benefits of travel outside of traditional tourism areas where other accommodation options are often concentrated. That restaurants and cafes particularly benefit from these dynamics is no surprise: they are community gathering places, and 77 percent of guests say wanting to live like a local matters in their decision to use Airbnb.
The influx of tourism spending by Airbnb guests at restaurants and cafes is being felt around the world. In Europe, Airbnb guests spent at least an estimated US$11 billion at restaurants and cafes in 2018, including over US$2.7 billion in France, US$1.7 billion in Spain, and US$1.3 billion in Great Britain. In the Americas, Airbnb guests spent at least an estimated US$10.2 billion at restaurants and cafes in 2018, including about US$7.6 billion in the United States, US$989 million in Canada, and US$650 million in Mexico. In Asia, Airbnb guests spent at least an estimated US$2.4 billion at restaurants and cafes in 2018, including more than US$755 million in Japan and US$493 million in China. Airbnb guests spent an estimated US$1.1 billion at restaurants and cafes in Australia and New Zealand in 2018, and about US$156 million in South Africa.
We look forward to sharing more updates on Airbnb’s impacts and how the community is changing the landscape and economics of travel.
2018 estimated guest spending at restaurants and cafes in 46 countries and regions is based on internal Airbnb data and approximately 14,000 responses to a voluntary survey sent to a sample of Airbnb guest accounts that had taken a trip to those places in 2018. 2019 estimates are based on the 2018 spending levels and Airbnb internal data for January-October 2019 and October-December 2018 periods. All other percentages related to Airbnb host and guest behaviors are based on more than 237,000 responses to the same voluntary survey to a sample of Airbnb host and guest accounts around the world. No payment or other incentive was provided in exchange for completing the survey.


